1
2
3
4
5
6
7
8
9
10
11
12
13
14
15
16
17
18
19
20
21
22
23
24
25
26
27
28
29
30
31
32
33
34
35
36
37
38
39
40
41
42
43
44
45
46
47
48
49
50
51
52
53
| import numpy as np
import matplotlib.pyplot as plt
class Dbscan:
def __init__(self, eps: int = 5, MinPts: int = 3):
self.eps = eps
self.MinPts = MinPts
self.points = None
self.group = None
self.group_counter = 1
def get_neighbors(self, idx: int):
neighbors = ((self.points - self.points[idx]) ** 2).sum(axis=1) <= (self.eps ** 2)
neighbors[idx] = False
return neighbors
def expand(self, idx: int):
if self.group[idx] != 0:
return
self.group[idx] = self.group_counter
neighbors = self.get_neighbors(idx)
if neighbors.sum() >= self.MinPts:
for i, is_neighbor in enumerate(neighbors):
if not is_neighbor:
continue
self.expand(i)
def fit(self, points: np.array):
self.points = points
self.group = np.zeros(points.shape[0], dtype=np.int32)
for idx, p in enumerate(self.points):
if self.group[idx] != 0:
continue
neighbors = self.get_neighbors(idx)
if neighbors.sum() >= self.MinPts:
self.expand(idx)
self.group_counter += 1
return self.group
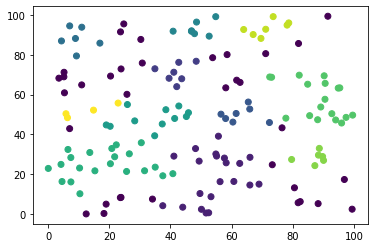
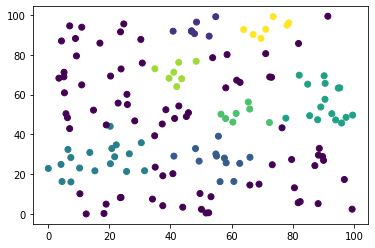
points = np.random.rand(150, 2) * 100
grp = Dbscan(eps=10, MinPts=5).fit(points)
plt.scatter(points[:, 0], points[:, 1], c=grp)
plt.show()
grp = Dbscan(eps=10, MinPts=6).fit(points)
plt.scatter(points[:, 0], points[:, 1], c=grp)
plt.show()
|


